We are pleased to announce NoSQL Manager for MongoDB 5.0.
In this release we focus on usability and performance improving of Shell, one of the most used features.
Also we’ve designed two new tools – Schema Analyzer and Performance Monitor.
You can find all changes in the article below.
1. New Shell parser conforms to ECMAScript 2016 standard.
Now you can split commands to several lines like shown in the sample below:
db.collection2
.find()
.limit(10)
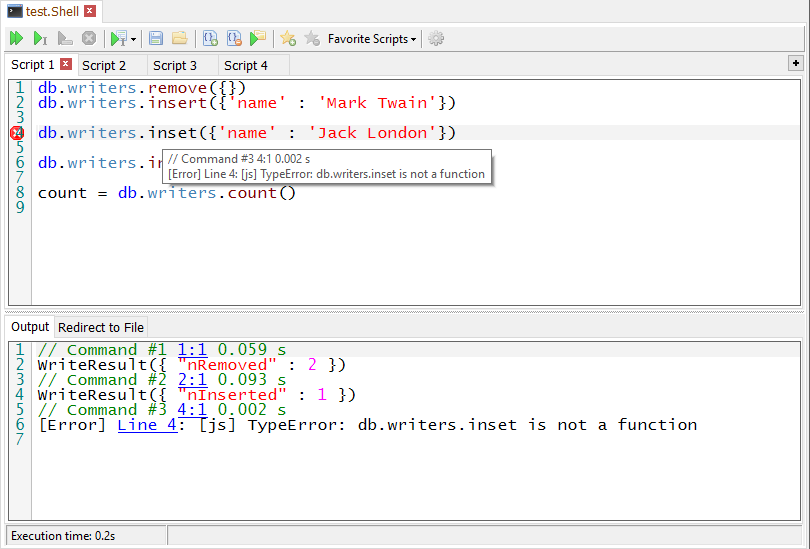
2. Now Shell highlights error lines.
Please look at the screen-shot below – line 4 is marked with special sign, because it has a mistake. Also you can see tool-tip with the error message. This feature makes it easier to find problem in your scripts.
3. New Schema Analyzer tool allows to visualize data distributions quickly and easily.
This tool is very useful when you want to learn the structure of collection’s data. Structure of sub-documents is analyzed too. You can define how many documents should be analyzed, specify to take documents from the beginning or from the end, to use random selection or to analyze all documents. You can stop analyzing process at any stage and see distribution of the processed documents only.
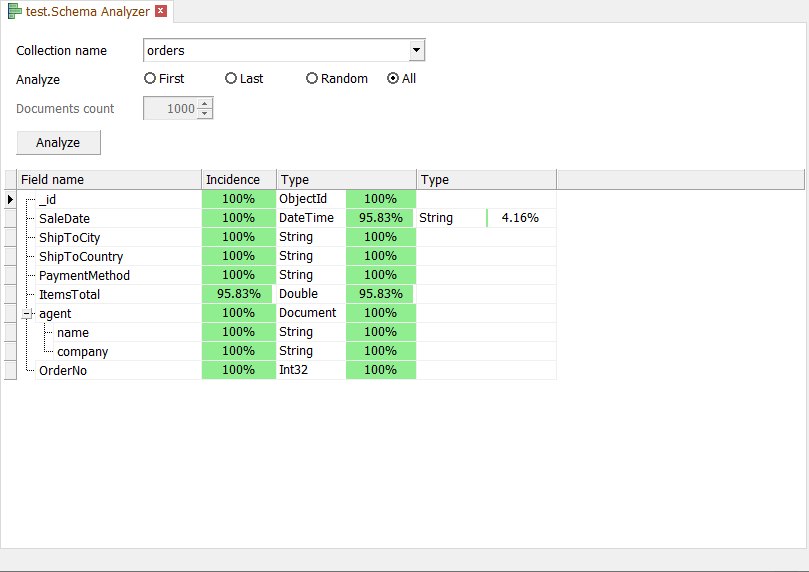
In this example you can see that every document has “_id” field. Most, but not all have “ItemsTotal”. “SaleDate” can be either datetime or string.
This tool is available in Professional version only.
4. New Performance Monitor tool.
Monitoring is an important part of MongoDB database administration. Performance Monitor allows you to observe state of your databases, diagnose problems before they escalate to failures.
The tool uses db.serverStatus() command and does not reduce MongoDB performance.
Performance Monitor collects and displays the following database metrics:
- Read and write operations per second
- Connections with read and write operations in progress or queued per second
- Queued read and write requests per second
- Number of client connections
- Virtual memory usage
- Memory used by the database process (resident)
- Number of page faults per second
- Network bytes in and out per second
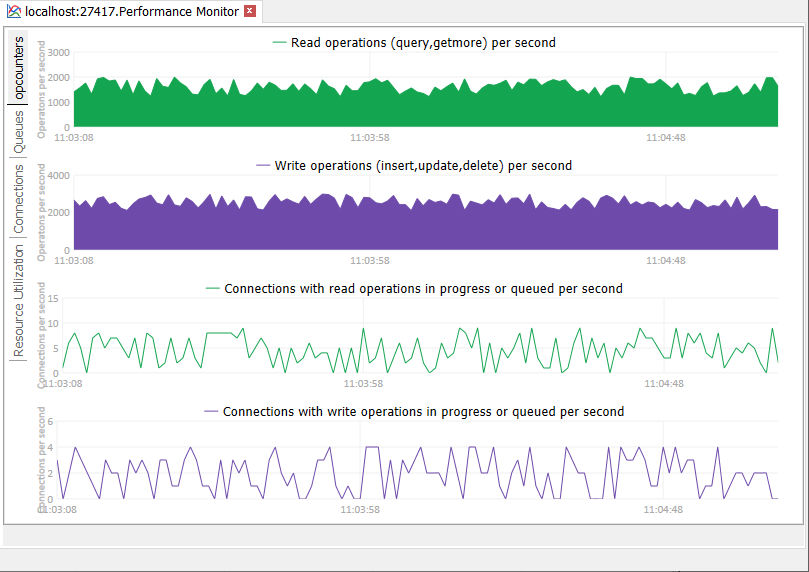
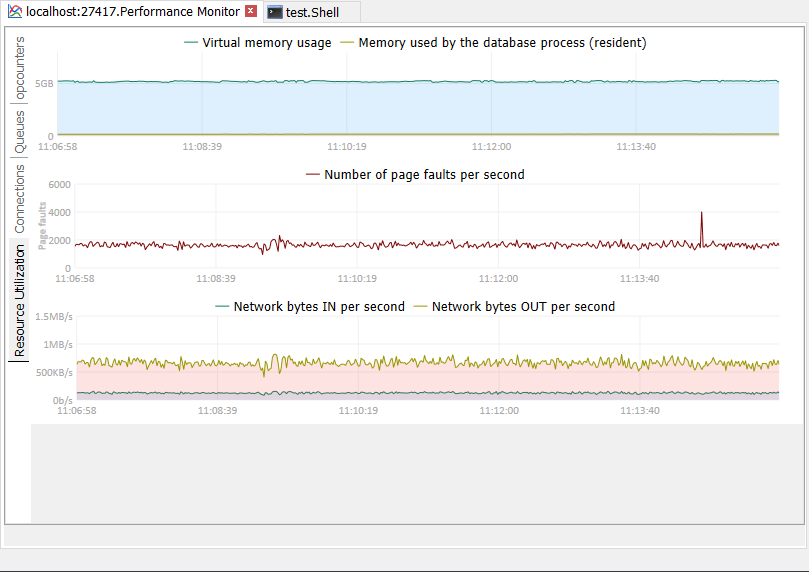
This tool is available in Professional version only.
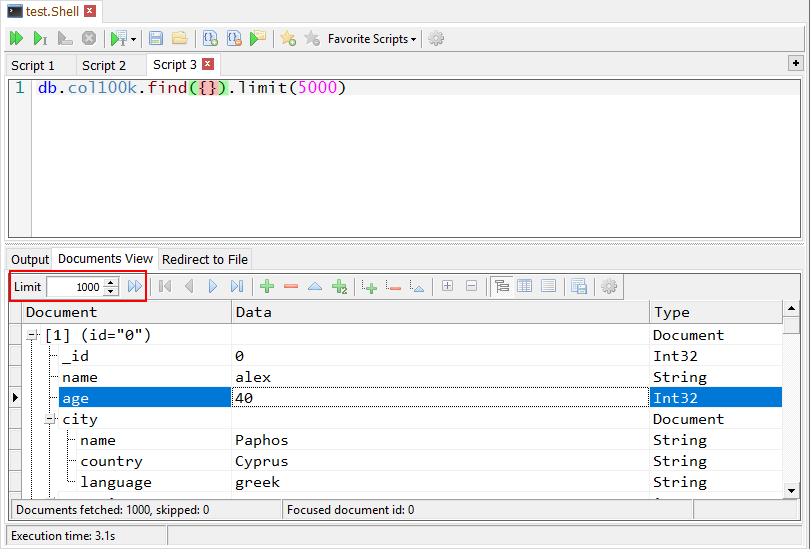
5. Shell: now paged mode is used to display result on Documents View tab.
Now Shell fetches all result documents but displays only limited count (1000 by default) of them at a time. You can view next document’s portion using Next Page button.
This allows to display result faster for large document set.
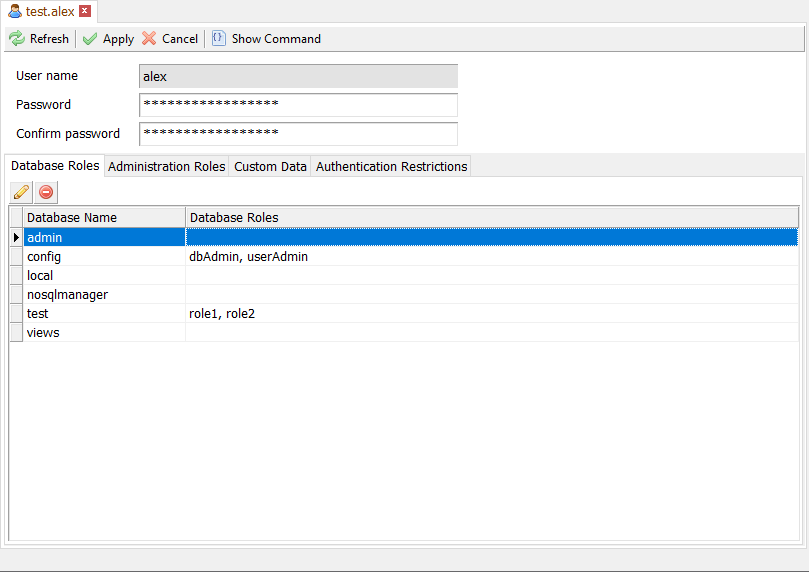
6. Reworked User Editor has better usability.
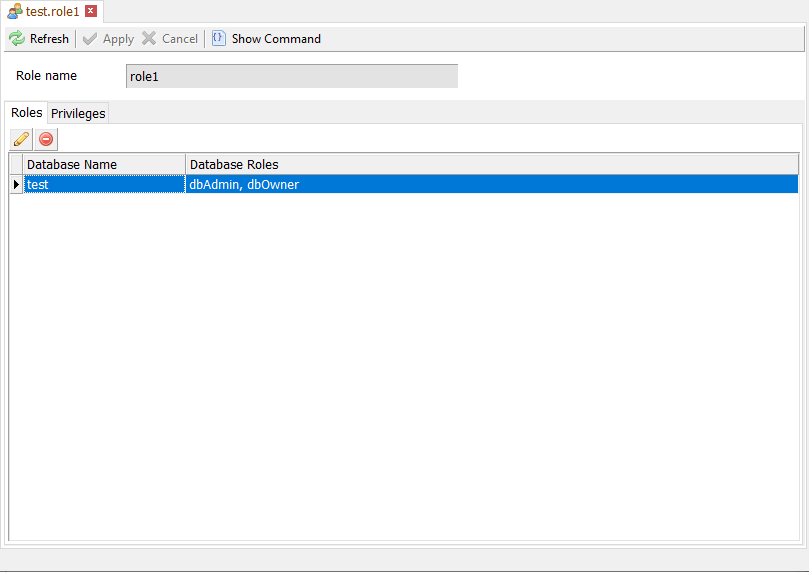
7. Improved Role Editor allows to manage roles and privileges easier.
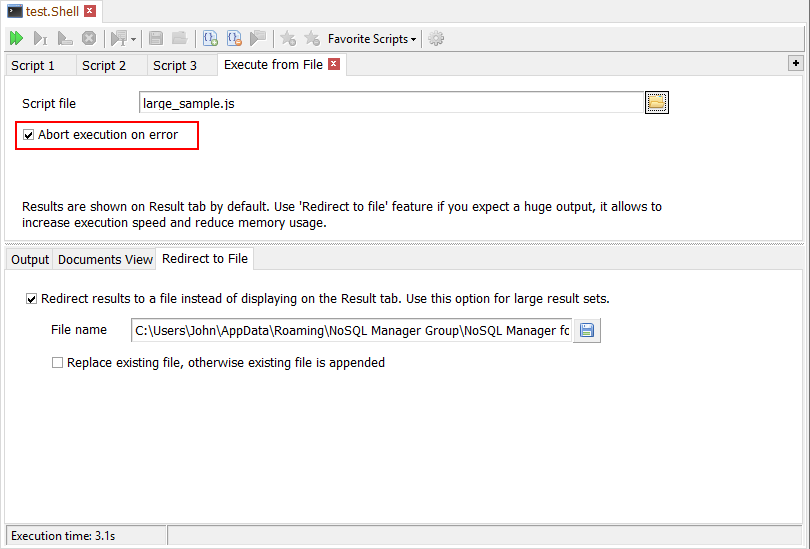
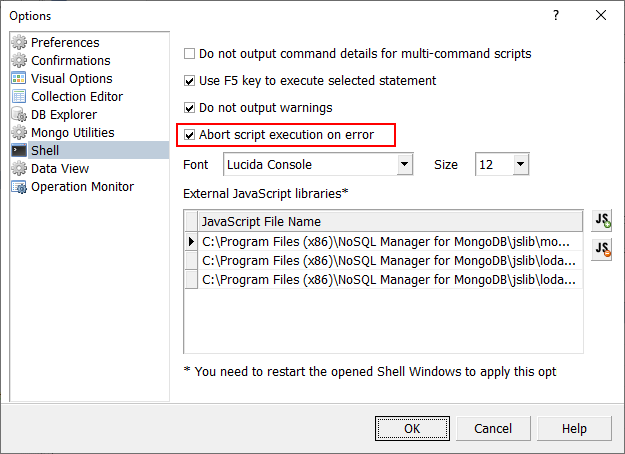
8. Shell: abort script execution on error option added.
This option controls Shell behaviour, either stop execution on error statement or ignore error and continue execution.
Useful for multi-statement scripts like insertion of packs of documents.
9. Shell: significantly reduced display time for large document set.
Sometimes you can get result in 2 times faster.
10. Greatly reduced memory usage for huge results.
11. Shell execute from file: Abort execution on error option added.